Barry, OppHub America Desk · · Source: yahoo-tickers-tape-movers
Amazon Stock Rises 3.6% as Holiday Season Scaling Begins
If holiday volume projections hold firm across major e-commerce channels, watch for potential multiple expansion supported by high-margin advertising and revenue growth.
Based on reporting from yahoo-tickers-tape-movers.
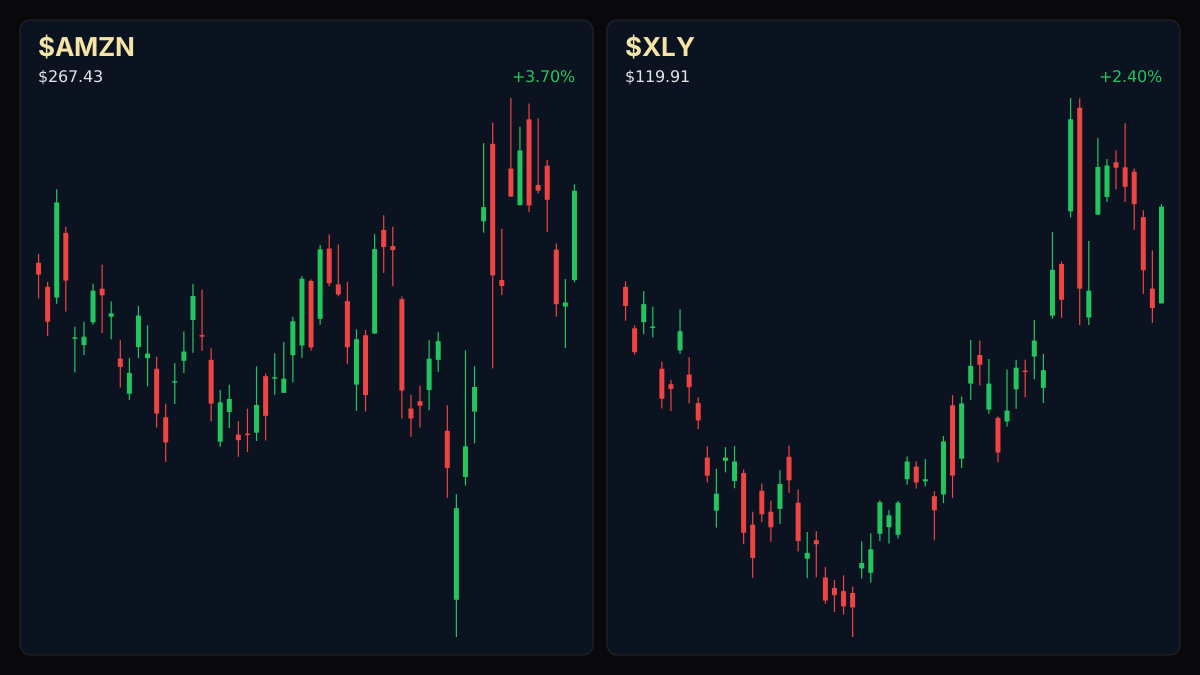
Amazon.com Inc. shares advanced 3.6% to $267.21 as holiday shopping campaigns approach. Investors are weighing whether fourth-quarter revenue projections and structural margin gains warrant capital allocation ahead of the peak retail window.
Market context for this story
As of: Regular HoursLoading quotes…
Informational only — not investment advice. Full markets →


$XLYConsumer Discretionary
TradingView
Live chart & market data via TradingView · OppHub classroom · Delayed or exchange real-time per TradingView data agreements · Not investment advice
Educational TradingView chart — search any symbol in the widget. Confirm on /markets/XLY and related $AMZN. Not investment advice.
Related markets
Shares a vertical MP4 loop to your phone's camera roll or app share sheet (Instagram, TikTok, Facebook Reels).
Amazon.com Inc. (NASDAQ: AMZN) shares moved higher on Wednesday, November 18, 2026, gaining 3.6% to trade at $267.21 as market participants evaluate retail volume expectations heading into Black Friday week.
### Session Tape - **Amazon.com Inc. ($AMZN+WL):** $267.21 (+3.6%)
## Catalyst Analysis: Holiday Scaling and Margin Focus As retail operations gear up for late-November promotional windows, market positioning centers on execution capacity rather than traditional near-term headline surprises. With sales growth targets framed between 12% and 16% and broader operating margin strength hitting historical highs of 13.9% in recent quarters, equity desks are assessing how high-margin segments like advertising and cloud infrastructure dictate overall valuation multiples.
### Story Arc / How We Got Here This session move builds on prior valuation scrutiny regarding infrastructure outlays, as outlined in our previous coverage of [Amazon Stock Faces $1.2T AI Spending Test: Valuation Focus](/explore/amazon-stock-faces-1-2t-ai-spending-test-valuation-focus). While long-term capital expenditure plans remain a core debate for cloud leaders, near-term price action reflects sentiment balancing structural profitability against seasonal consumer demand.
## $AMZN+WL Technical Analysis & Key Risk Watch
77.54 · R1 ## $AMZN+WL Technical Analysis & Key Risk Watch 63.20 · last ## $AMZN+WL Technical Analysis & Key Risk Watch 56.14 · S1 ## $AMZN+WL Technical Analysis & Key Risk Watch 55.01 · S2 ## $AMZN+WL Technical Analysis & Key Risk Watch 48.80.
- **Session Move:** +3.6% ($267.21 absolute) - **Key Levels & Risk Watch:** Investors tracking $AMZN+WL are monitoring whether the equity can hold support near recent breakout thresholds as holiday volume prints. Key resistance sits near prior session highs, while failure to hold immediate support could trigger profit-taking consolidation toward moving average boundaries.
### Money Play - If holiday volume projections hold firm across major e-commerce channels, watch **$AMZN+WL** for potential multiple expansion supported by high-margin advertising and AWS revenue growth. - For broader equity positioning, track how capital flows rotate between mega-cap technology vehicles and consumer discretionary exposure during peak retail catalysts.
Read the full story
Original reporting and related coverage — attribution links only, not paid recommendations.
Trade this story (crypto)
 Coinbase
 Gemini
 Robinhood
 Webull
Chart this story
 TradingView
Broker and exchange buttons use invite / refer-a-friend links (rewards may be capped). Charting links (TradingView) are partner offers that may pay OppHub America a commission at no extra cost to you.
OppSHOP
Full OppSHOP →As an Amazon Associate, OppHub America earns from qualifying purchases. Shopping here helps keep the site free — at no extra cost to you. Disclosure

OppSHOP
Related to this story
If holiday volume projections hold firm across major e-commerce channels
Shop related →

Investing books
Read the classics
Shop this pick →

Personal finance books
Run the household books
Shop this pick →

Trading notebooks
Write the thesis first
Shop this pick →

Monitor for charts
See every pane
Shop this pick →
Story playbook
A pre-built map of what to watch — stocks, ETFs, and educational next steps. Not personalized advice.
Snapshot date: November 18, 2026 at 1:46 PM ET
This playbook was built when the story published and is not live-updated. Prices, news, and risk can change after this date — treat it as a starting map, not a current trade ticket.
Story → money map
holiday retail scaling
Amazon stock went up because the holiday shopping season is starting and people expect strong sales. Investors care because higher sales and profits can make the company more valuable over time.
What changed
Amazon shares advanced 3.6% to $267.21 as investors position for holiday shopping demand and structural margin gains.
Who wins / who loses
E-commerce giants and digital advertisers benefit from holiday spending, while traditional brick-and-mortar retailers lacking strong online logistics may struggle.
Time horizon
Think in terms of the next few weeks.
Confidence & best fit
medium confidence · Long-term investor, Active trader
Safer theme exposure (ETFs)
Baskets that own the theme without betting on one company.
Single stocks (higher risk)
Primary = closest to the story · Peers = same industry · Second-order = knock-on effects · Avoid = looks related but may be a trap
Primary
- $AMZNBuild slowly — only if it fits your plan
Amazon is the main stock here because strong holiday sales directly boost its revenue and profits.
View $AMZN chart → · End-of-day delayed data
Peer
- $WMTWatch — track, don’t rush
Walmart is a major rival competing for the exact same holiday shoppers.
View $WMT chart → · End-of-day delayed data
- $SHOPWatch — track, don’t rush
Shopify powers smaller online stores that also see a big rush during holiday shopping.
View $SHOP chart → · End-of-day delayed data
Second-order
- $FDXWatch — track, don’t rush
Delivery companies like FedEx get a surge of business moving all those holiday packages.
View $FDX chart → · End-of-day delayed data
Options (education only)
No strikes or expiries — a framework for how traders might express the view. Options can expire worthless.
Direction: bullish · Style: Debit spread (defined risk) · Level: intermediate
Beginners should skip options because they are complex and risky; buying the stock directly is safer.
Income / OppHub America angle
Not a trade tip — ways to use the insight outside the market.
- Local courier and warehouse part-time employment opportunities during the peak fulfillment rush
What would break this thesis
- Significantly weaker-than-expected holiday consumer spending data
- Broader macroeconomic downturn affecting discretionary retail demand
What to do next on OppHub America
Saved playbooks stay on this device for now.
Important
Not financial advice. OppHub America playbooks are educational market maps only — not recommendations to buy, sell, or hold any security. Markets move fast; information can be wrong or outdated. Trade and invest at your own risk. Do your own research or consult a licensed advisor.
Based on reporting from yahoo-tickers-tape-movers.
Informational and educational only — not investment, financial, or legal advice. Disclosure
Shares a vertical MP4 loop to your phone's camera roll or app share sheet (Instagram, TikTok, Facebook Reels).