OppHub America Desk · · Source: yahoo-tickers-tape-movers
HD Stock: Q3 Beat Overshadowed by Tepid Guidance and Rate Pressures
Monitor broader interest rate trajectories and residential housing data for spillover effects across retail and lending sectors.
Based on reporting from yahoo-tickers-tape-movers.
Home Depot posted a third-quarter revenue and earnings beat on Tuesday, November 17, 2026, yet its stock slipped as management issued a tepid full-year outlook. Higher mortgage rates driven by climbing Treasury yields continue to stall the broader housing recovery, weighing on consumer activity.
Market context for this story
As of: After HoursLoading quotes…
Informational only — not investment advice. Full markets →

$HDHome Depot (The)
TradingView
Live chart & market data via TradingView · OppHub classroom · Delayed or exchange real-time per TradingView data agreements · Not investment advice
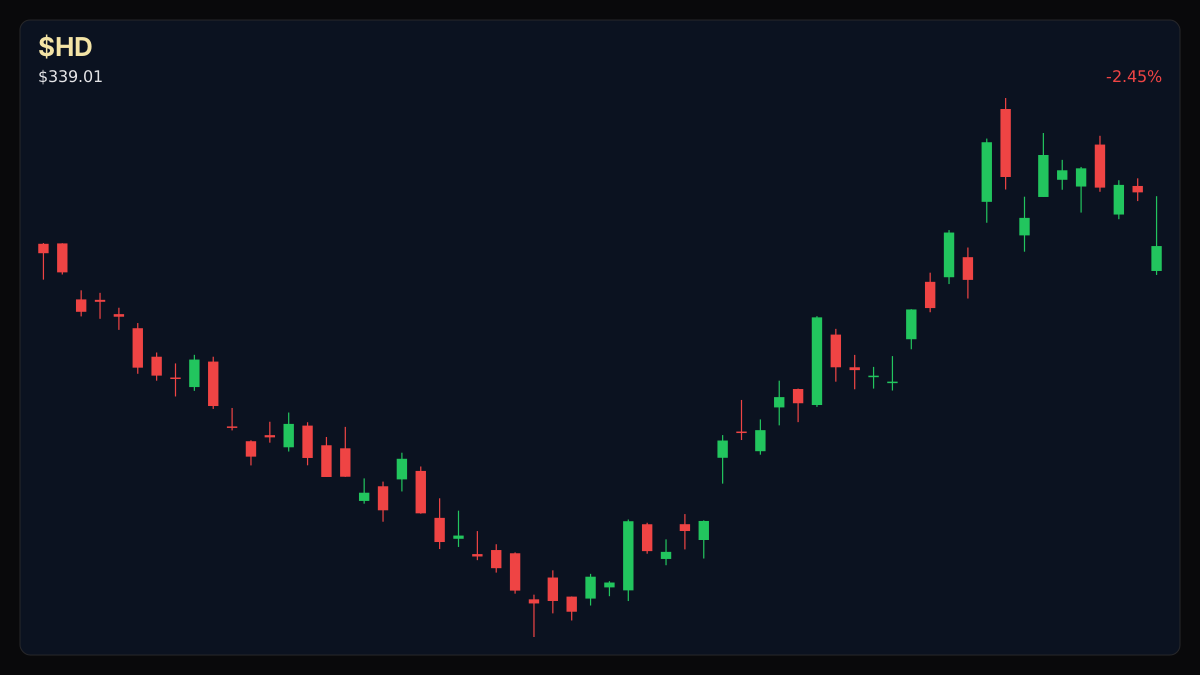
Educational TradingView chart — search any symbol in the widget. Confirm on /markets/HD. Not investment advice.
Related markets
Shares a vertical MP4 loop to your phone's camera roll or app share sheet (Instagram, TikTok, Facebook Reels).
Home Depot (NYSE: HD) posted a third-quarter earnings and revenue beat on Tuesday, November 17, 2026, but the equity slipped as management issued a tepid full-year outlook amid mounting headwinds in the housing sector.
### Money Play Market participants tracking home improvement retail and macro sensitivity should monitor broader interest rate trajectories, as residential turnover remains tied to mortgage financing costs.
## Catalyst Analysis: Q3 Print and Outlook Home Depot reported comparable sales growth of 2.2% alongside adjusted earnings per share of $3.86, topping Wall Street consensus estimates of $3.84. Total revenue reached $43.40 billion, surpassing the $42.78 billion estimate and climbing 4.95% year over year. Average ticket size rose 3.0% to $93.09, while comparable transactions slipped 0.5% to 392.7 million.
Despite the top-line beat, management adjusted its fiscal guidance. The revised outlook projects approximately 1.4% comparable sales growth and about 2.0% adjusted EPS growth from a $14.69 base, down from previous expectations. Gross margin guidance edged down to approximately 33.0% from 33.1%, and third-quarter operating margin contracted to 12.6% from 12.9%.
Industry commentators note that retail operators in this space function as interest-rate proxies. With the 10-year Treasury yield climbing past 5% and sending mortgage rates higher, existing-home sales have softened to yearly lows, limiting broader renovation spending from traditional homeowners.
## $HD+WL Technical Analysis & Key Risk Watch
77.54 · R1 ## $HD+WL Technical Analysis & Key Risk Watch 63.20 · last ## $HD+WL Technical Analysis & Key Risk Watch 56.14 · S1 ## $HD+WL Technical Analysis & Key Risk Watch 55.01 · S2 ## $HD+WL Technical Analysis & Key Risk Watch 48.80.
Market positioning reflects cautious near-term consolidation as interest rate sensitivity dominates tape flow. Price action remains tightly correlated with macro fixed-income movements rather than standalone operational metrics.
Read the full story
Original reporting and related coverage — attribution links only, not paid recommendations.
Trade this story
 Robinhood
 Webull
 Tradier
 IBKR
Chart this story
 TradingView
Broker and exchange buttons use invite / refer-a-friend links (rewards may be capped). Charting links (TradingView) are partner offers that may pay OppHub America a commission at no extra cost to you.
OppSHOP
Full OppSHOP →As an Amazon Associate, OppHub America earns from qualifying purchases. Shopping here helps keep the site free — at no extra cost to you. Disclosure

OppSHOP
Related to this story
Monitor broader interest rate trajectories and residential housing data
Shop related →

Investing books
Read the classics
Shop this pick →

Personal finance books
Run the household books
Shop this pick →

Trading notebooks
Write the thesis first
Shop this pick →

Monitor for charts
See every pane
Shop this pick →
Aftermath · $NVDA
-0.44% vs write
- •Since this piece: $NVDA is down -0.44% vs $156.14 at write time (now $155.46).
- •Session move (Yahoo delayed): -0.44%.
- •RSI14 at write was 16 — compare levels on Markets, not advice.
- •Original money play lens: Monitor broader interest rate trajectories and residential housing data for spillover effects across retail and lending sectors.
- •Track $NVDA live on OppHub Markets (/markets/NVDA). Not financial advice.
Based on reporting from yahoo-tickers-tape-movers.
Informational and educational only — not investment, financial, or legal advice. Disclosure
Shares a vertical MP4 loop to your phone's camera roll or app share sheet (Instagram, TikTok, Facebook Reels).